Please check out our FAQ in the left sidebar.

The Adventures of Bear, featured a cute ice cream scoop pregraphing activity that starts with a fun dice and counting game and ends with using the scoops to make a simple bar graph. It's very hands on and a great maniuplative game for young learners.
The following activity was sent to us by Katie from Katie's Nesting Spot's mother-in-law, a retired middle school math teacher:
Take a simple outline picture, maybe from a coloring book, and put it on graph paper with numbered axis. For older children you can use positive and negative numbers. Then make a list of points around the picture(in order). Give the child the list and blank graph paper and have them make the picture by finding the points and connecting in order. I used to have a big collection of very elaborate ones because middle school kids love these. Sometimes they made the list of points for me to do and sometimes I gave them a list. An easy one is a maple leaf outline or a pumpkin which can then be colored.

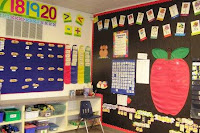
Simple Yes/No Circle Time Graph: as seen in the picture above, the white posterboard area between the apple chart and blue 100s chart.
One thing most young children are quite knowledgable and are willing to talk about is themselves! Get to you know your kids, introduce simple graphing and comparision language, with a simple graph that can be easily incorporated into your circle time.
To Make:
Cut posterboard into a large rectangle, size to fit in your circle time or calendar area. Turn it into a t graph, by drawing a straight line down the center the long way and a horizontal one near the top. Draw a smile face on one side and a frowning face on the other at the top. Write YES by the smile face and NO by the frowning face.
Take pictures of each student, sized about one inch square; laminate for durability with clear packing tape. Attach velcro to the back. Attach velcro dots to the graph. If you have twenty students attach twenty velcro dots on both side of each graph.
Make a weekly or biweekly graphing question but writing it on sentence strips or by computer generating one. Tie the question into current studies, like letter of the week or seasonal activities.
Procedure:
Read the question of the day out load to the class. Shuffle student picture cards, pick one at a time, and have that student come up and answer the question. I always made it a point to require students to use a complete sentence when answering the question. For example, "Yes, I do have a cat." After each child has had a turn, discuss the results using comparision language such as more or less, how many, etc.
The following are some suggestions for YES/NO graphs:
Would you pet an alligator?
Do you like ants?
Do you think apes are cute?
Do you like apples?
Do you like to go camping?
Have you ever been to Canada?
Do you like carrots?
Do you have a cat?
Do you like chocolate chip cookies?
Have you ever milked a cow?
Would you like dinosaurs to become real?
Do you like dogs?
Would you ever like to live on a farm?
Do you like frogs?
Have you ever petted a giraffe?
Do you know how to play golf?
Would you jump into a pile of leaves?
Would you travel to the moon?
Do you like noodles?
Have you ever seen an octopus up close?
Do you like olives?
Who wore pajamas to school today?
Do you like pickles?
Do you like penguins?
Do you like salad?
Have you ever had a snowball fight?
Do you like spiders?
Are you missing any teeth?
Would you pet a tiger?
Do you like turtles?
Do you like to plant vegetables?
Should we make the pumpkin scary?
Are you afraid of the dark?
Do you sleep with the light on?
Will you go out of town during the break?
Do you like to eat turkey?
Do you like pumpkin pie?
Do you have a Christmas tree at home?
Have you ever made a gingerbread house before?
Do you like to eat gingerbread cookies?
Have you ever petted a rabbit before?
Have you ever dyed an Easter egg before?
Graphs can be easily incorporated into many themes. Some suggestions for cooperative class and individual graphs:
- Favorite color
- Favorite color of apple to eat or favorite way to eat apples, i.e. cut up, apple sauce, apple pie, apple bread, apple juice, etc. Both are a fun thing to do after a taste test!
- Number of people in your immediate family
- How many pets you have
- Holiday treats: Use popular candies associated with various holidays, for example: jelly beans by color for Easter. Sort by color and then graph how many of each you have.

Emily at Learning Vicariously, show us a great example on how easy it is to incorporate graphing with simple questions. Check out their family graph.
We'd love to see what you've been graphing! Be sure to send us in your activities!


.jpg)

We just did our first informal graphing activity today. The kids liked it a lot.
ReplyDeleteMy kids love M&M graphing. I posted about it last summer:
ReplyDeletehttp://mamasmiles.com/blog/?p=275
We'll have to try some of these other graphing activities!