
Hello all! I'm Rachelle and I am from the blog, What the Teacher Wants! You can find tips for teachers, parents, and anyone in between! I'm a 1st grade teacher from Utah. I am obsessed with Sharpie pens, blogging, cute clipart/fonts, teaching, reality T.V., and organizing closets {does that make me weird?}.
I am so excited to be guest blogging here on ABC and 123. I will have a series here dedicated to giving you ideas about how to learn with food. All of these ideas can be adapted to any level!


- Supplies: Fruit Loops and Printable
- Objective: Sort, Graph, and Analyze data
- Procedure:
2. Graph the results on the bar graph using crayons to color in each square on the graph.
3. Answer the questions about your data that you collected
4. Eat the Fruit Loops!
{Click the picture below for the printable}

M&M Picture Graph-
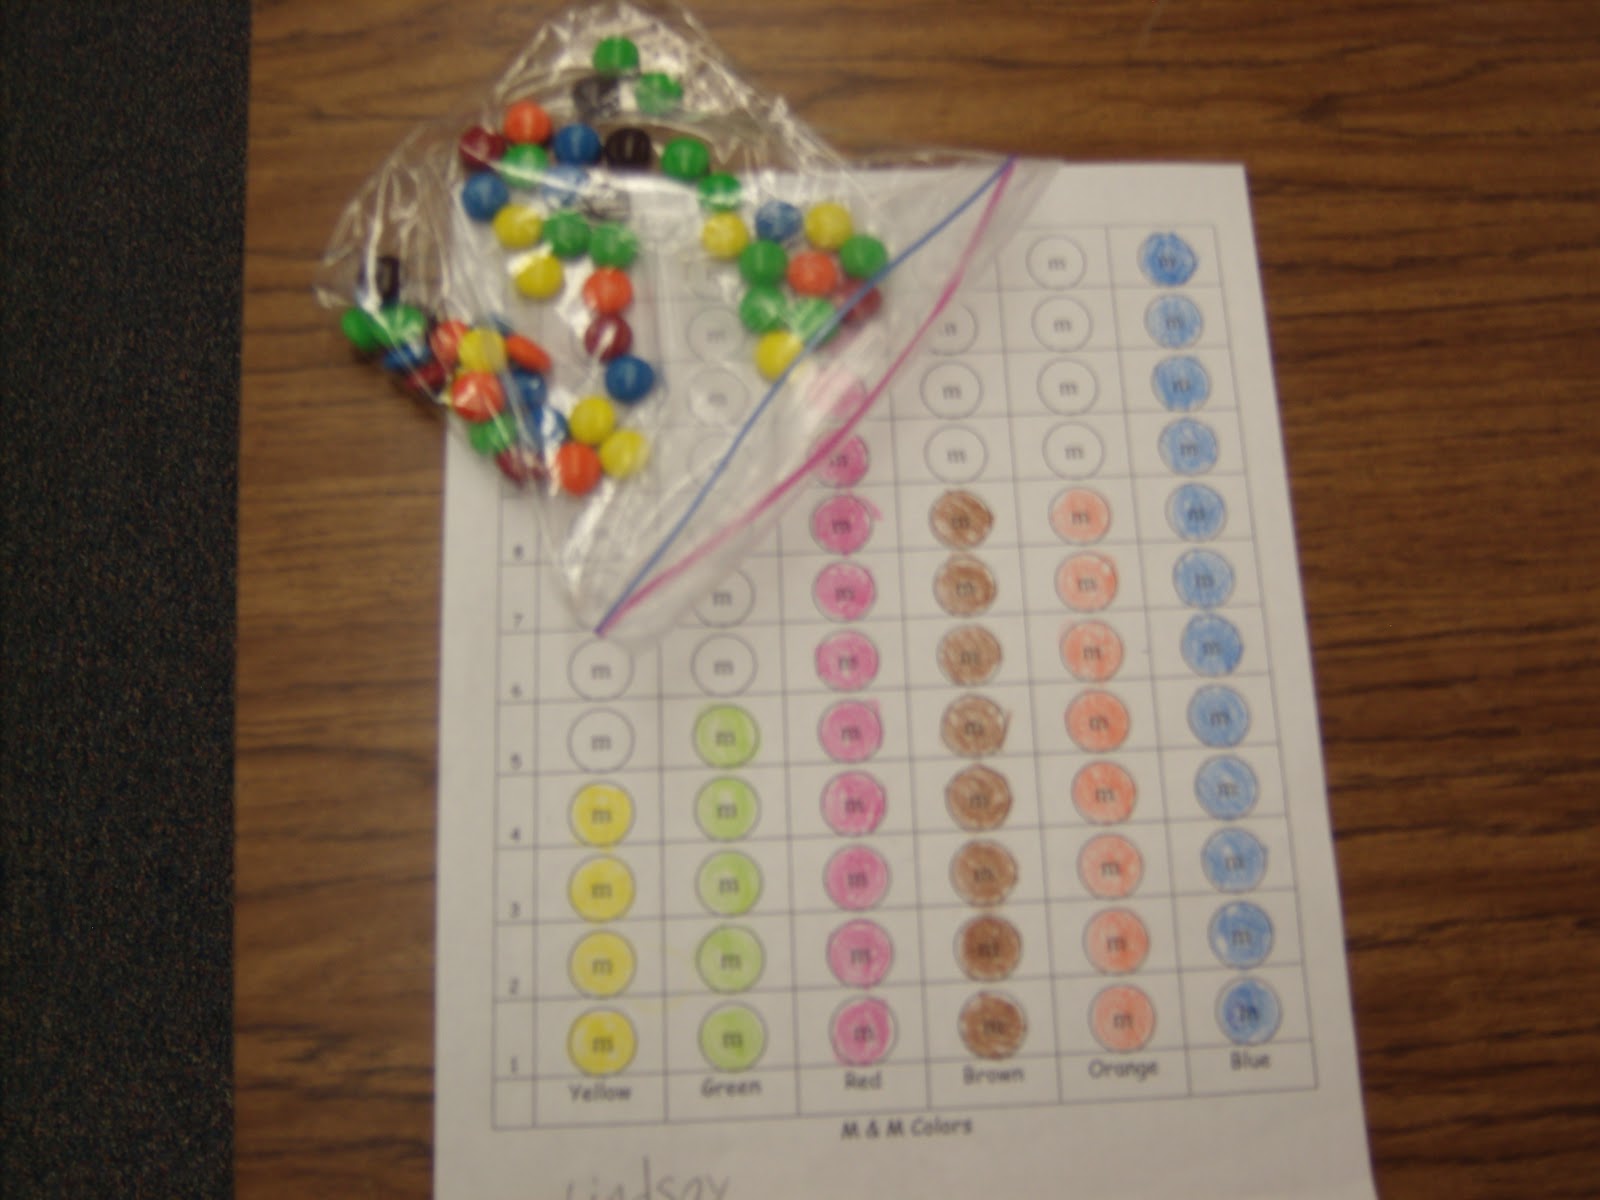
- Supplies: M&M's, Printables {2}, pencil, and crayons
- Objective: Sort, Graph, and Analyze data
- Procedure:
1. After putting about 1/4 cup of M&M's into a Ziplock, the child will sort the candy by color.
2. Graph the results on the picture graph using crayons to color in each picture on the graph.
3. Answer the questions about your data that you collected.{Click here for that printable}
4. Eat the M&M's!
{Click the picture below for the picture graph printable}

What foods do you like to graph with?
Visit my blog What the Teacher Wants
for tons more free printables and great learning ideas!
Clipart/Font provided by Dj Inkers.
What foods do you like to graph with?
Visit my blog What the Teacher Wants
for tons more free printables and great learning ideas!
Clipart/Font provided by Dj Inkers.

.jpg)
I like to graph with skittles
ReplyDeleteWe graph with Lucky Charms for St. Patty's Day and Conversation Hearts on Valentine's Day. :)
ReplyDeleteIt's a neat idea to use food to learn about graphing.
ReplyDeleteI love this! An extension for upper grades would be to calculate the mean, median, mode, and range of the data. Also, it's a great time introduce Excel to students. Have them enter the data into a spreadsheet and teach students how to turn the numbers into a nice graph.
ReplyDeletelove it! I am going to try the Fruit Loop math graph with my kinders on Friday! Thanks so much for these, you're so kind to share them!!!!!!
ReplyDelete